Hello, I'm
I'm a data-driven enthusiast with expertise in Python, SQL, and building seamless data pipelines on Azure platforms. With a strong foundation in data analysis, visualization, and machine learning, I like to transform raw data into meaningful insights. Passionate about innovation and growth, I continuously challenge myself through hands-on projects and lifelong learning. 🚀


About Me
As a final-year undergraduate in Computer and Information Systems Engineering. Currently, I am deepening my expertise in data engineering, particularly in building Azure data pipelines and exploring innovative ways to manage and transform data efficiently.
Previously, I worked as a research assistant, where I analyzed datasets related to Pakistan's pharmaceutical imports. This work provided actionable insights for research publications and enhanced my ability to extract meaningful information from data.
I am also keen on applying machine learning techniques to solve real-world challenges, with a focus on practical, hands-on projects that strengthen my understanding.
- Python
- SQL
- Tableau
- Azure
- Git
My Projects
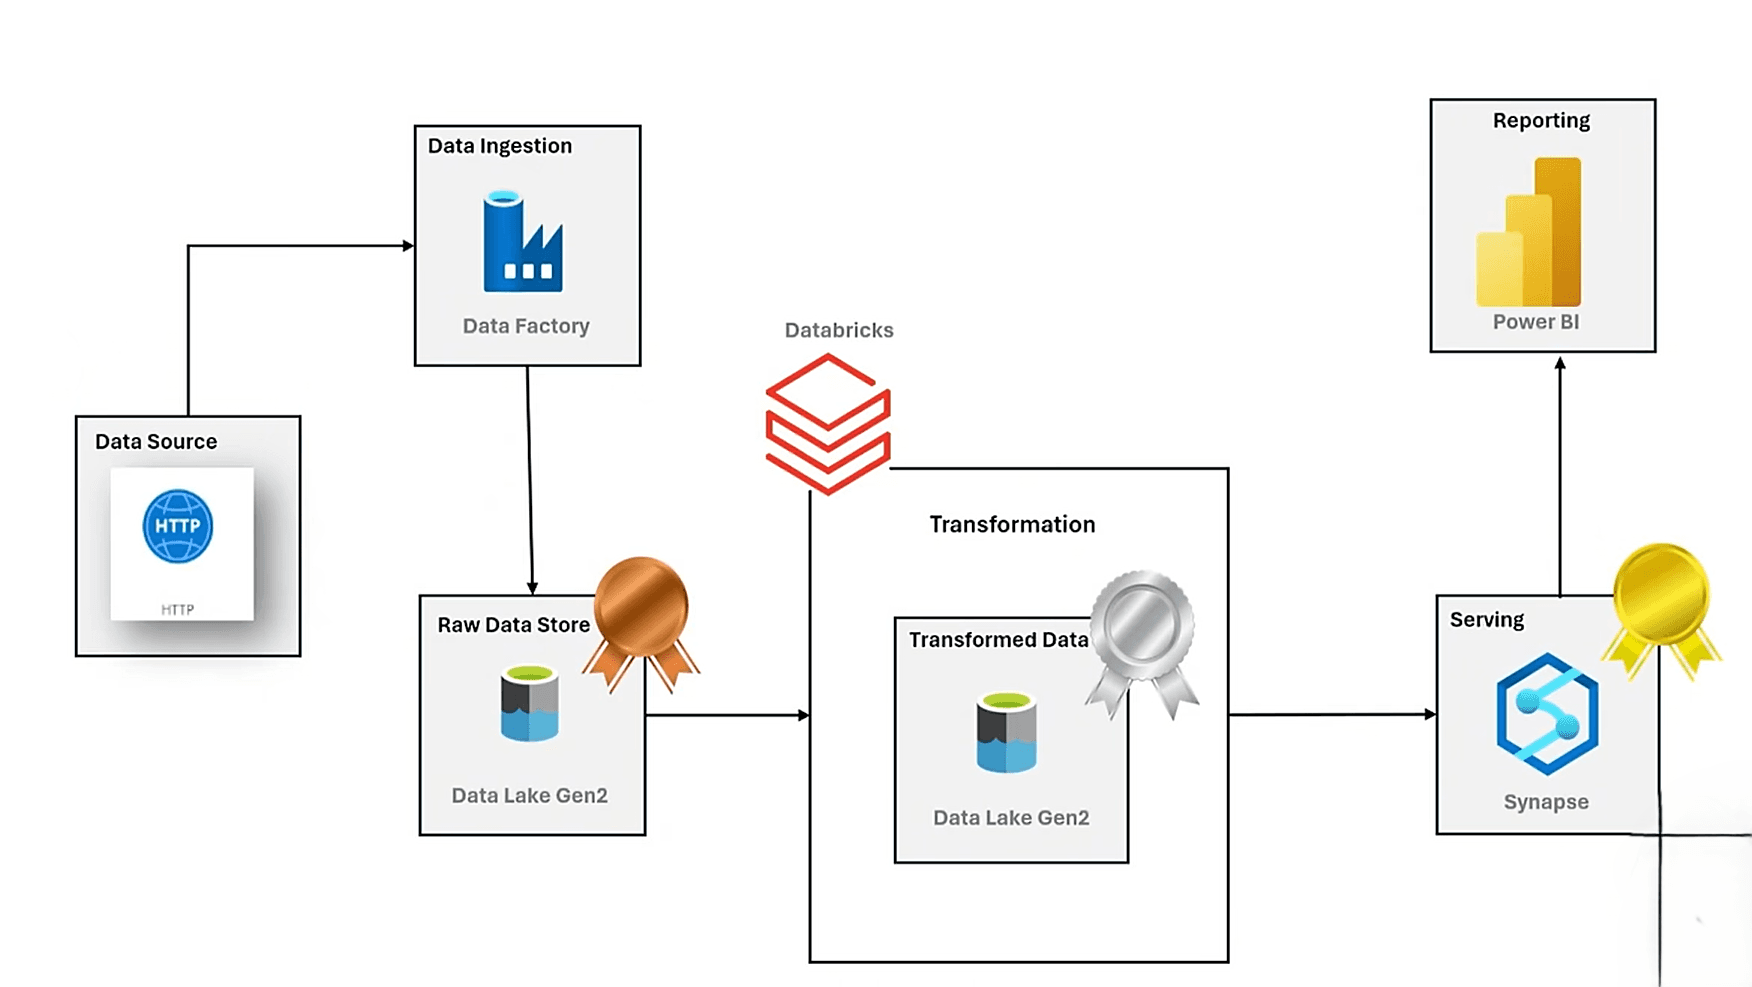
End-to-End Data Pipeline Architecture with Azure
This project showcases a data pipeline built using Azure Data Factory, Azure Databricks, Azure Data Lake Gen2, Azure Synapse Analytics, and Power BI. It automates data ingestion, transformation, storage, and visualization, ensuring scalable insights. Data is extracted from GitHub, stored in Data Lake Gen2, transformed in Databricks, and processed in Synapse Analytics. Finally, insights are visualized through Power BI dashboards.
Azure Data FactoryDatabricksAzure Synapse AnalyticsPower BI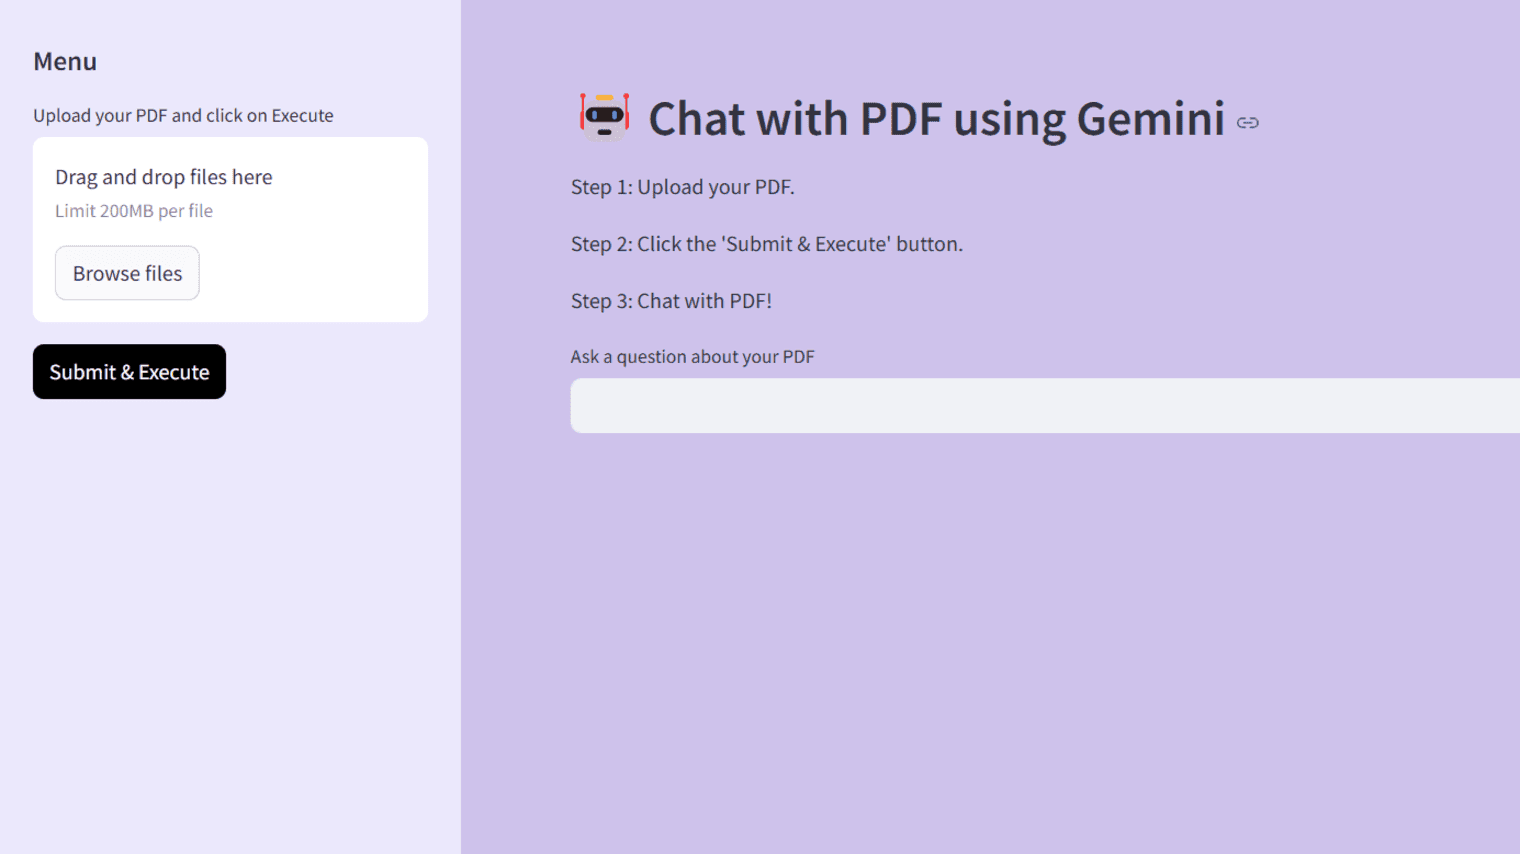
Gemini PDF Bot
Gemini PDF Bot is a Streamlit-based chatbot that allows users to interact with PDF documents. It lets you upload a PDF, ask questions, and receive answers based on the document’s content, powered by Google’s Gemini AI and FAISS for vector storage.
PythonNLPFAISSStreamlit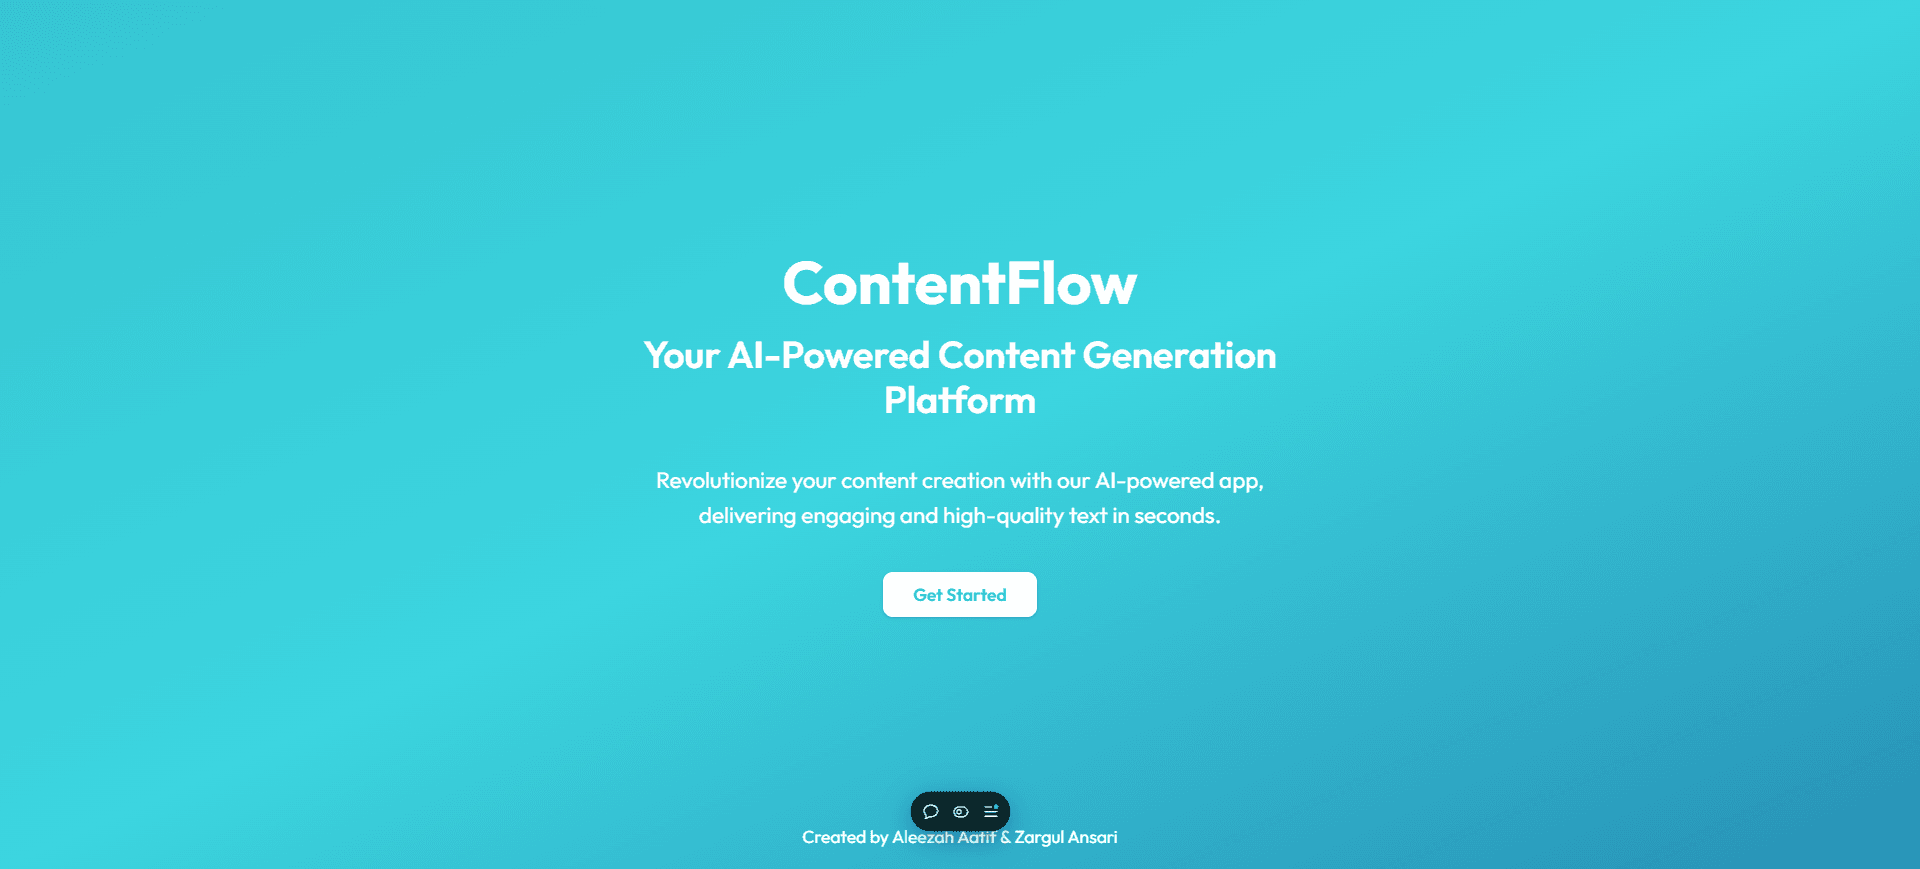
ContentFlow
ContentFlow is an AI-powered platform for generating engaging content tailored to specific topics. It’s designed for creators, bloggers, and businesses, featuring a seamless user interface and integrated payment options. The tech stack includes Clerk for authentication, Drizzle for database management, and LemonSqueezy for subscription and payment processing.
Next.jsReactTailwindCSSLemonSqueezyClerkDrizzle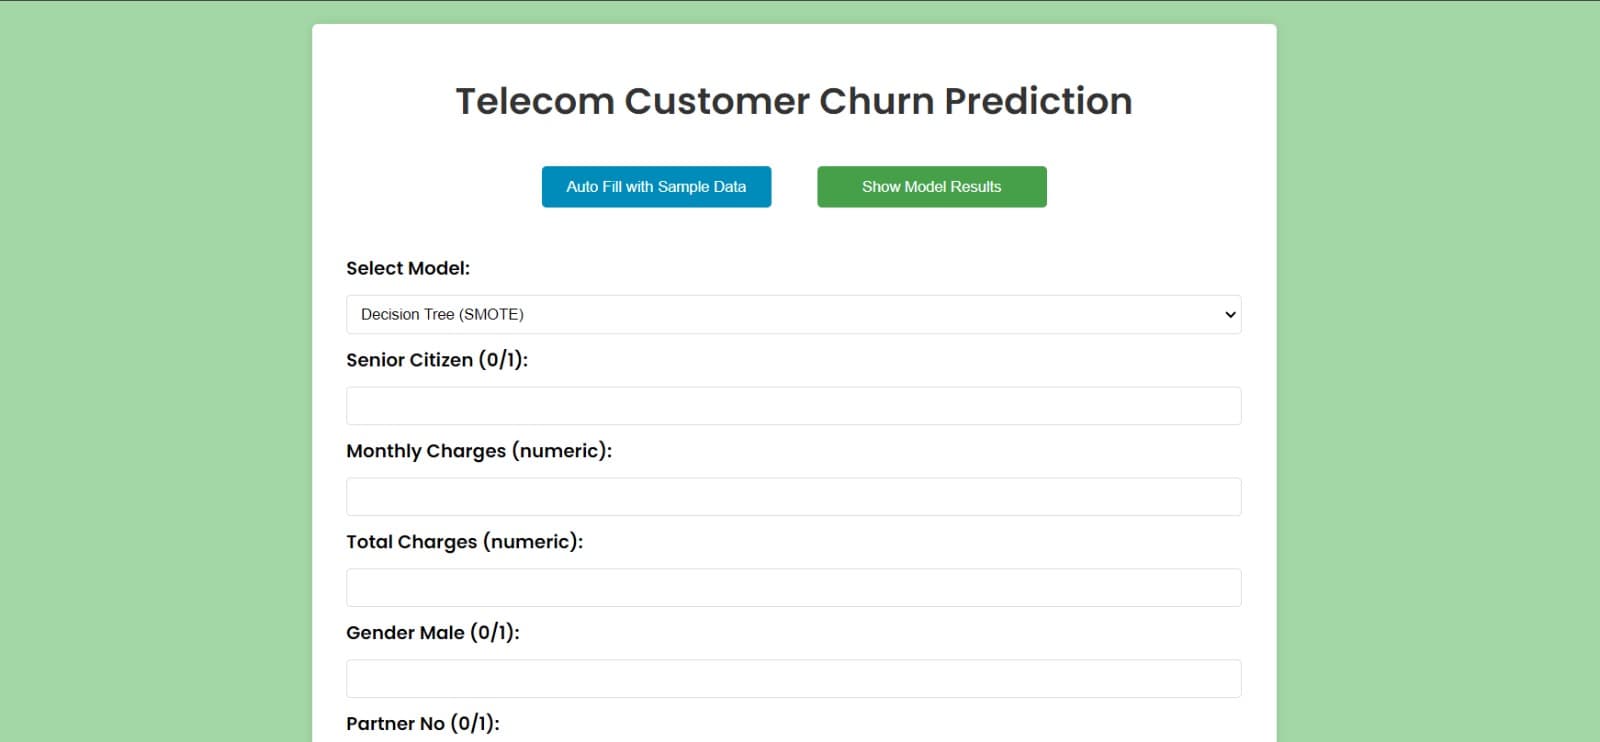
Telecom Churn Prediction
This academic project predicts telecom customer churn using machine learning models such as Logistic Regression, Decision Tree, KNN, and Random Forest. It includes EDA on the churn dataset and a Flask-based UI for interactive predictions.
PythonMachine LearningFlask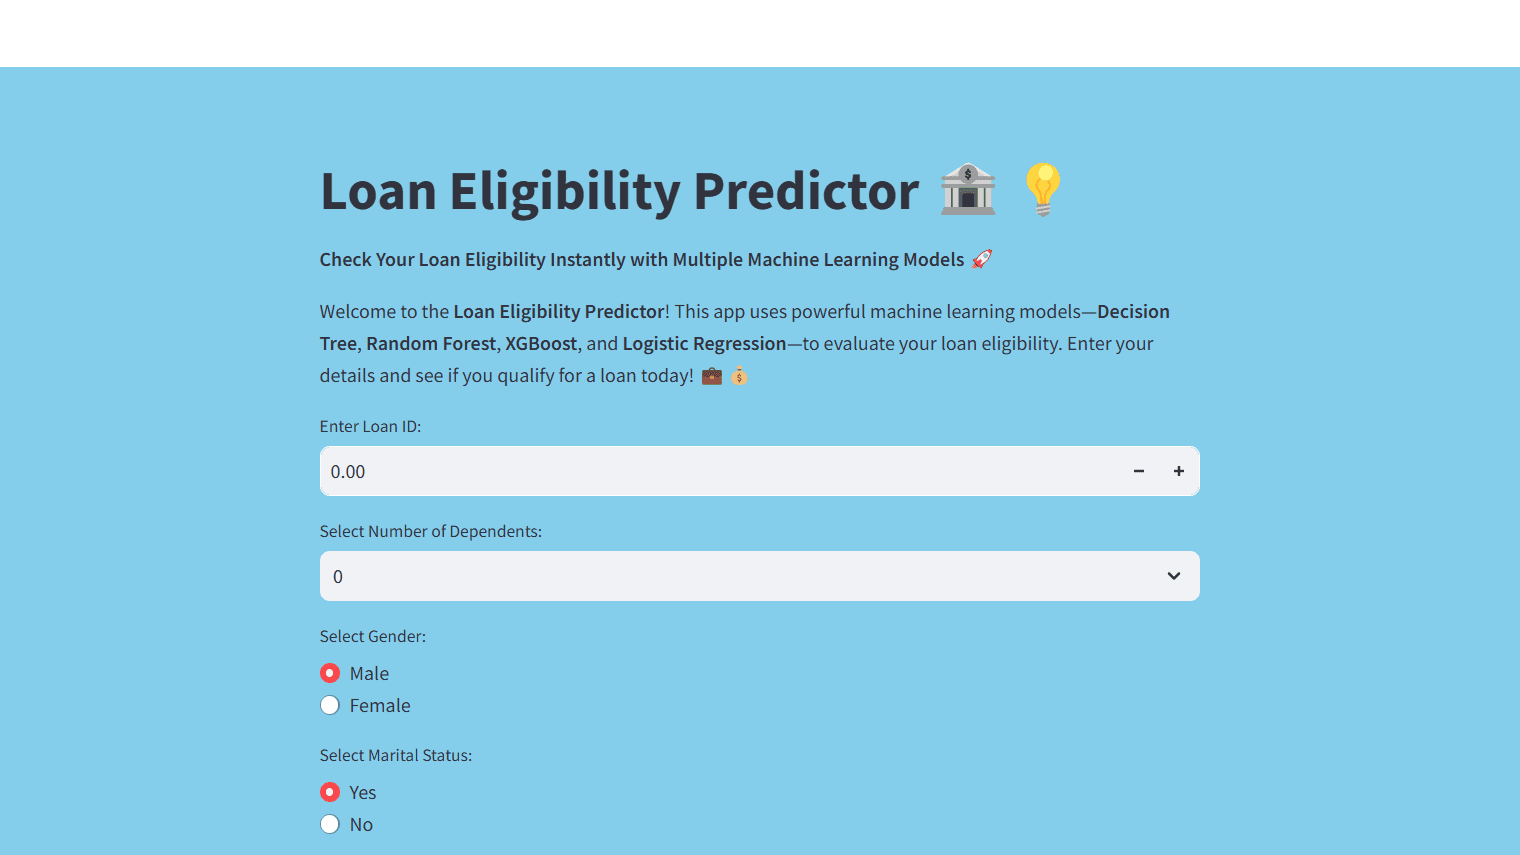
Loan Prediction System
This project predicts loan eligibility using multiple machine learning models: Decision Tree, Random Forest, XGBoost, and Logistic Regression. The models are fine-tuned using Grid Search Cross-Validation (GridCV) to ensure optimal performance, achieving an overall accuracy of 85%.
PythonMachine LearningScikit-learnStreamlit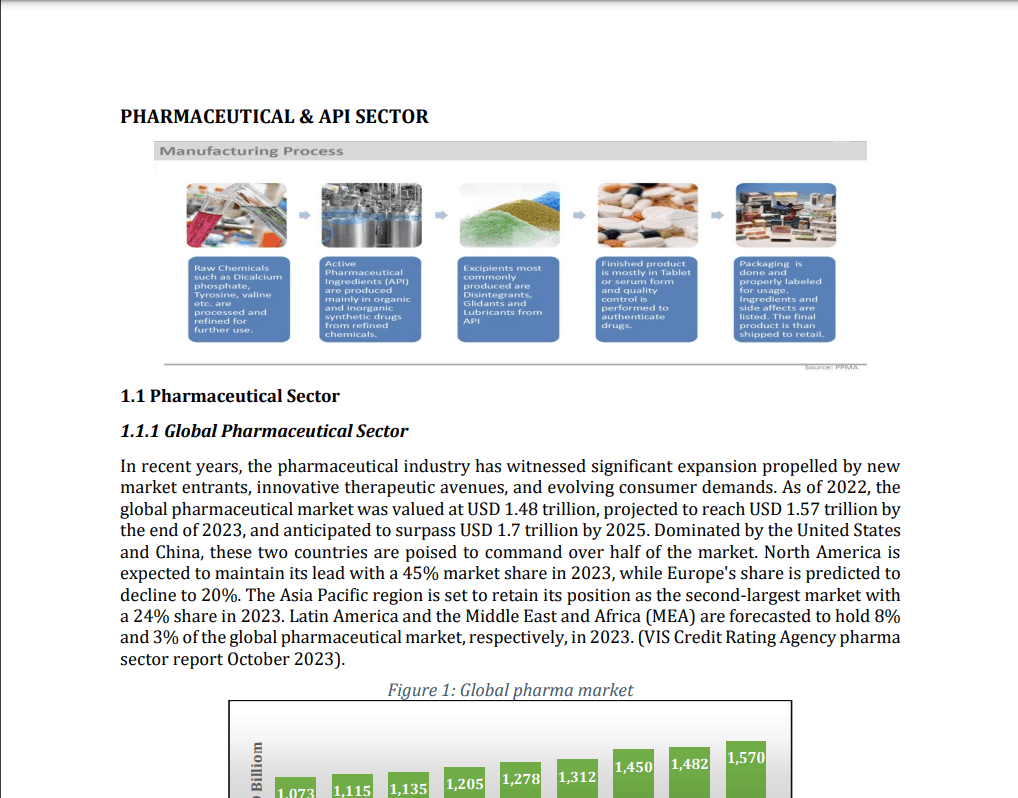
Active Pharmaceutical Ingredients (API) Manufacturing: Case Study of Pakistan
In this research paper, I contributed to the data analysis section by working with Pakistan's customs data to extract valuable pharmaceutical-related information. Using Python and MS Excel, I processed and analyzed the data to identify key trends and patterns in the pharmaceutical industry. The insights were then presented through interactive dashboards built with Tableau, enabling a clear and comprehensive understanding of the industry’s landscape and its growth trajectory in Pakistan.
PythonMS ExcelTableau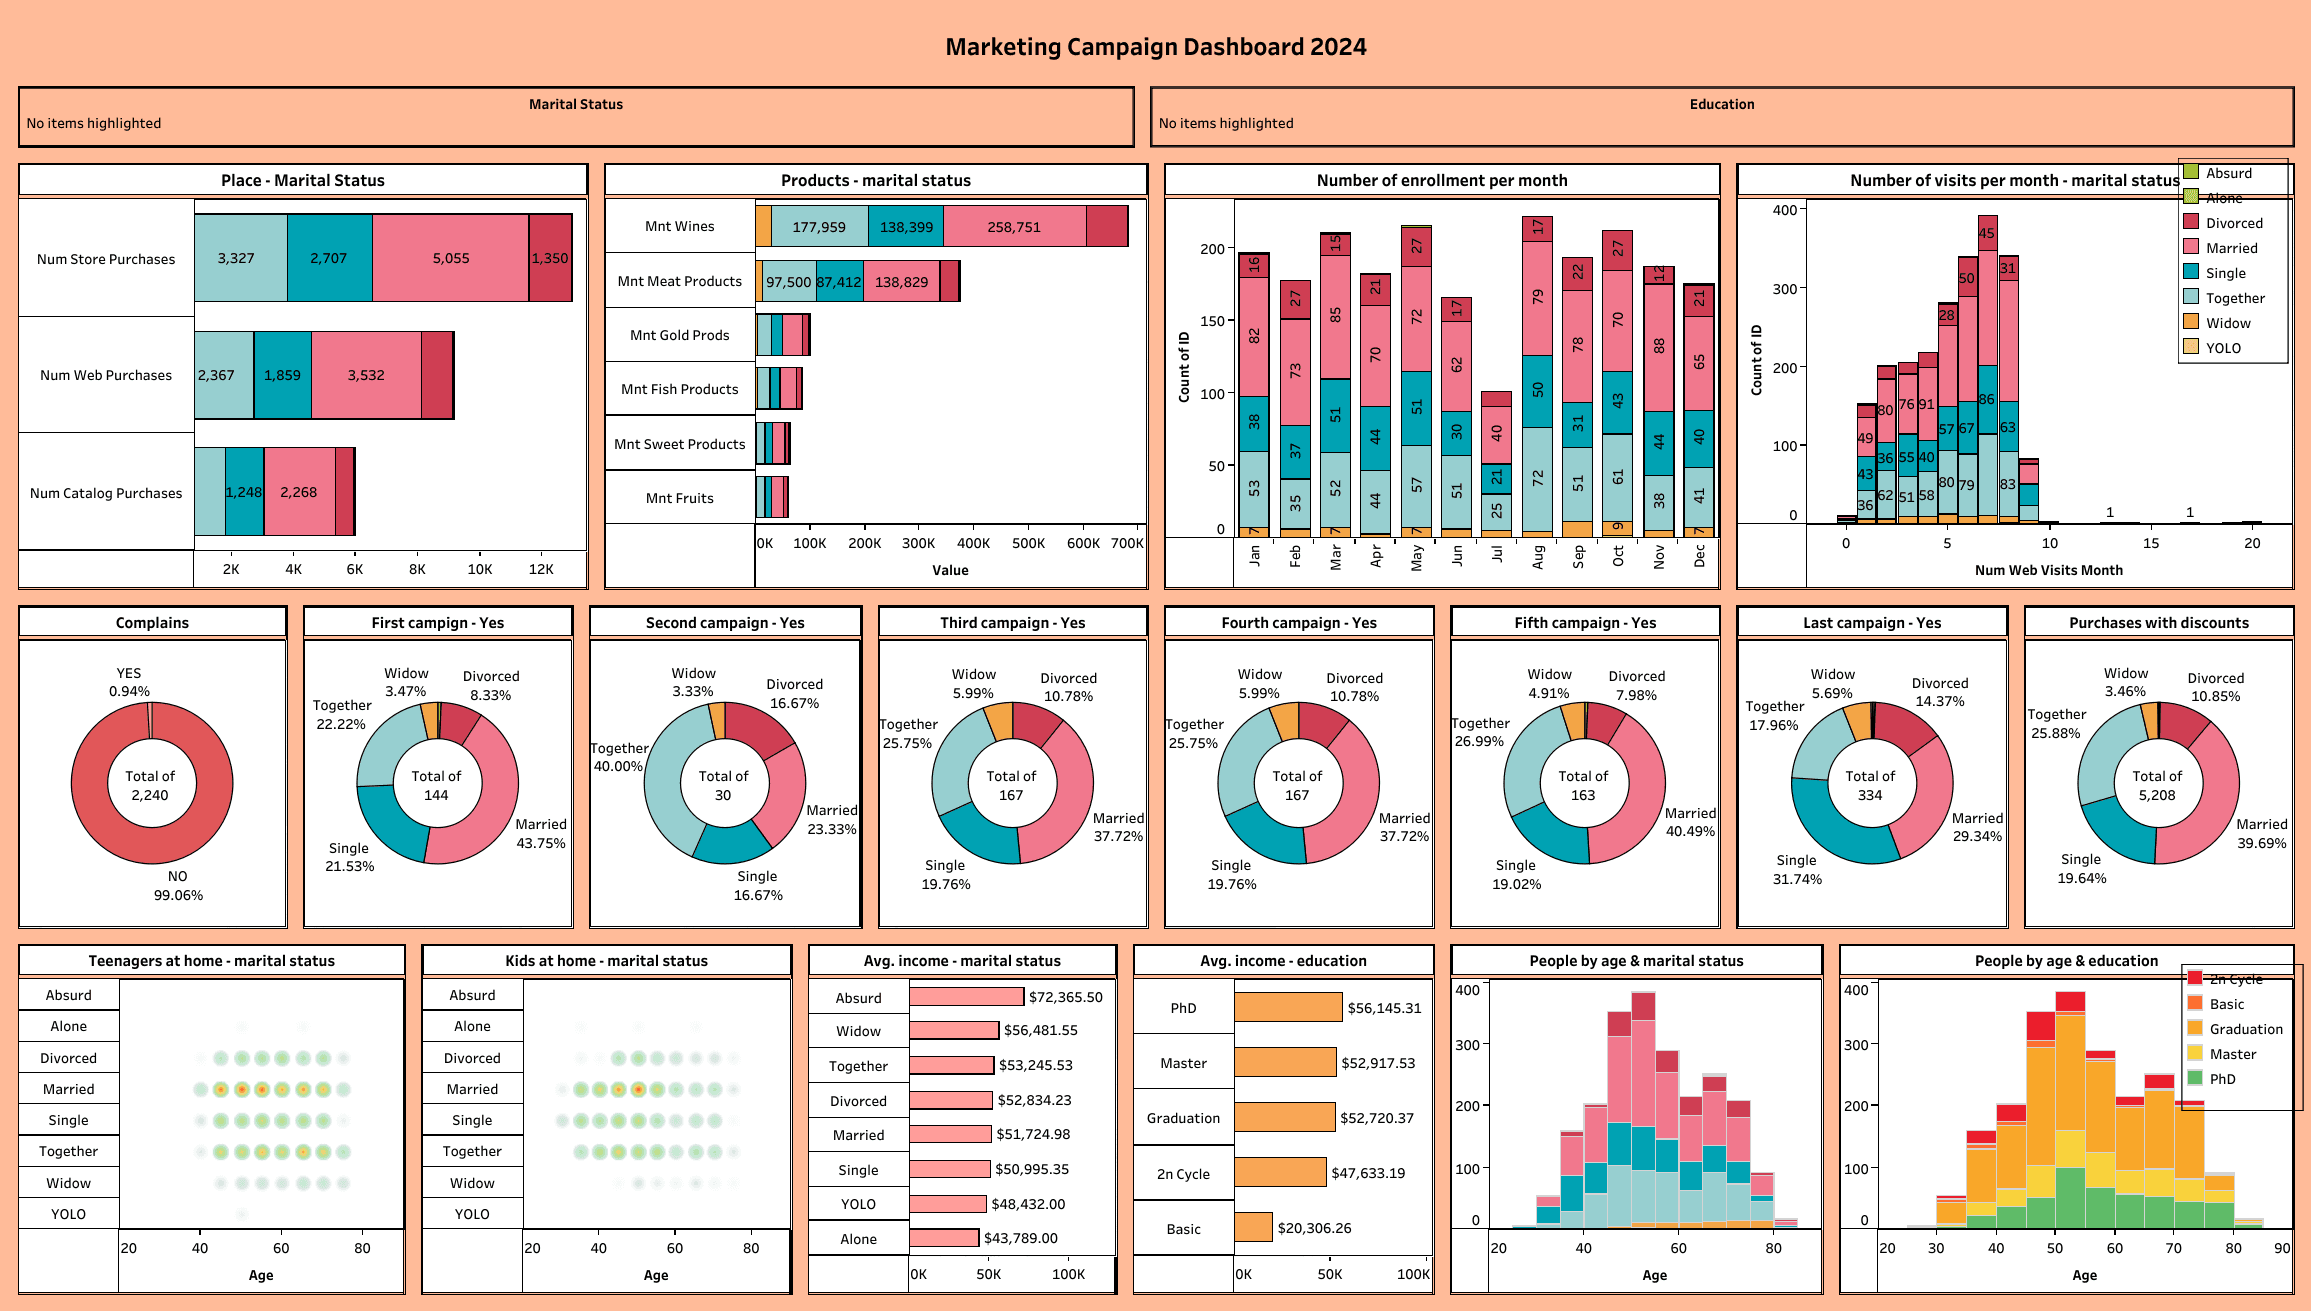
Marketing Campaign Dashboard
This dashboard is designed to analyze and extract valuable insights from marketing campaign data. It features interactive charts and graphs to visualize campaign performance, audience engagement, and conversion rates.
Tableau
Let's Collaborate
I'm always excited to discuss new opportunities or collaborations. Feel free to reach out!